


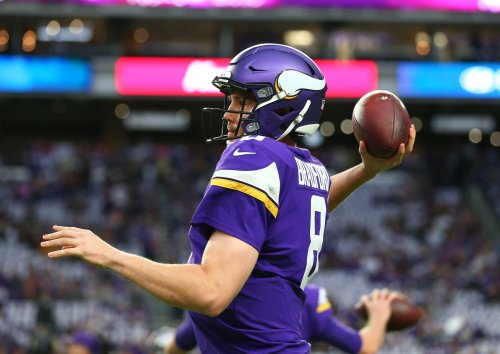
The Minnesota Vikings carry a heavy stigma of continuously failing to find a long-term quarterback.
Typically, that spells doom for a franchise.
The surprising part of Mike Zimmer's tenure in Minnesota has been the Vikings' ability to win at a fairly high level despite having a different Week 1 passer each of Zimmer's four seasons. That includes three consecutive years where the primary quarterback had his best career season (Teddy Bridgewater in 2015, Sam Bradford in 2016 and Case Keenum in 2017).
The common link between these three? A low number of interceptions and a high completion percentage. Not to mention a strong defense providing them support.
I crunched the data on the last three years of passing stats for all 32 NFL teams to see where the Vikings stood in various categories. Check out the chart below, initially ordered by highest touchdown-to-interception ratio. No surprise that New England blows away the field, but Minnesota isn't far behind in fifth.
(But seriously, New England!)
| TDs | INTs | RATIO | COMP. | ATT. | PCT. | TOT. YDS. | |
|---|---|---|---|---|---|---|---|
| NE | 100 | 17 | 5.88 | 1,161 | 1,766 | 65.7 | 13,313 |
| SEA | 91 | 32 | 2.84 | 1,041 | 1,611 | 64.6 | 11,571 |
| KC | 65 | 23 | 2.83 | 1,038 | 1,562 | 66.5 | 11,099 |
| GB | 96 | 34 | 2.82 | 1,103 | 1,755 | 62.8 | 10,869 |
| MIN | 59 | 22 | 2.68 | 1,065 | 1,569 | 67.9 | 10,517 |
| NO | 93 | 35 | 2.66 | 1,318 | 1,877 | 70.2 | 14,233 |
| CIN | 74 | 29 | 2.56 | 1,002 | 1,578 | 63.5 | 10,987 |
| DET | 86 | 35 | 2.46 | 1,182 | 1,796 | 65.8 | 12,506 |
| OAK | 86 | 35 | 2.46 | 1,099 | 1,759 | 62.5 | 11,561 |
| WAS | 82 | 36 | 2.28 | 1,140 | 1,702 | 67.0 | 12,604 |
| ATL | 80 | 36 | 2.22 | 1,127 | 1,688 | 66.8 | 13,094 |
| BUFF | 56 | 26 | 2.15 | 870 | 1,415 | 61.5 | 9,204 |
| LAC | 91 | 45 | 2.02 | 1,157 | 1,830 | 63.2 | 13,220 |
| PHI | 77 | 41 | 1.86 | 1,126 | 1,796 | 62.7 | 11,409 |
| NYG | 82 | 44 | 1.86 | 1,142 | 1,829 | 62.4 | 11,705 |
| AZ | 84 | 48 | 1.75 | 1,075 | 1,806 | 59.5 | 12,392 |
| CAR | 78 | 45 | 1.73 | 899 | 1,565 | 57.4 | 10,351 |
| PITT | 88 | 51 | 1.73 | 1,156 | 1,776 | 65.1 | 13,185 |
| JACK | 80 | 47 | 1.70 | 1,040 | 1,760 | 59.1 | 11,429 |
| IND | 71 | 43 | 1.65 | 1,010 | 1,690 | 59.8 | 10,798 |
| TB | 77 | 47 | 1.64 | 1,045 | 1,718 | 60.8 | 12,144 |
| HOU | 72 | 45 | 1.60 | 1,004 | 1,727 | 58.1 | 10,287 |
| DAL | 63 | 41 | 1.54 | 968 | 1,504 | 64.4 | 10,243 |
| MIA | 75 | 48 | 1.56 | 1,054 | 1,667 | 63.2 | 10,846 |
| TEN | 68 | 45 | 1.51 | 955 | 1,551 | 61.6 | 10,235 |
| SF | 52 | 37 | 1.41 | 971 | 1,624 | 59.8 | 10,152 |
| LAR | 53 | 38 | 1.39 | 905 | 1,527 | 59.3 | 9,587 |
| NYJ | 68 | 53 | 1.28 | 996 | 1,664 | 59.9 | 10,705 |
| CHI | 53 | 43 | 1.23 | 972 | 1,555 | 62.5 | 10,443 |
| BAL | 61 | 50 | 1.22 | 1,228 | 1,922 | 63.9 | 11,401 |
| DEN | 58 | 56 | 1.04 | 1,039 | 1,742 | 59.6 | 10,988 |
| CLE | 50 | 54 | 0.93 | 1,021 | 1,750 | 58.3 | 10,274 |
Only six teams threw fewer touchdowns over this span that the Vikings: the Bills, 49ers, Rams, Bears, Broncos and Browns. Sure, Denver won a Super Bowl thanks to its marvelous defense three seasons ago -- and Los Angeles reached the playoffs last year -- but these have generally been among the league's worst teams over the last three seasons.
Minnesota used a conservative passing approach and an Adrian Peterson-heavy gameplan in 2015 to avoid mistakes, but they've managed to take care of the football equally well in subsequent seasons while throwing the ball at a more normal rate. Only two teams besides the Vikings have thrown single-digit interceptions each of the last three years: New England and Kansas City.
The Vikings also rank second in completion percentage since 2015, trailing only New Orleans and veteran Drew Brees, who re-set his own completion percentage record one season after Bradford broke it with Minnesota in 2016.
The caveat: New Orleans leads the league in passing yards while being 70 percent accurate. That's scary.
Minnesota ranked 25th in passing attempts and 23rd in passing yards in this span. The low marks can be blamed on the 2015 team, which achieved the rare feat of passing for under 3,000 yards. In a sample size that is still relatively small, one odd season can throw off the data, especially when there is a different coordinator at the helm. However, there are other examples that show teams' remarkable consistency from year to year. For instance, Pittsburgh threw the ball 590, 596 and 590 times, respectively the last three seasons.
The bottom line is that the Vikings are unique. They've managed to amass a 32-16 record and two playoff berths over three seasons despite several different quarterbacks and two different offensive coordinators. While Minnesota's passers have been bottom-third in several categories, including touchdown passes, their decision-making with the football has given the Vikings ample opportunity to win, which is exactly what a stout defense needs to thrive.
Other non-Vikings observations:
Cam Newton's Panthers have the lowest completion percentage on the chart (57.4), and only the Bills have completed fewer balls over the previous three seasons.
Buffalo's profile is actually somewhat similar to the Vikings' with touchdown passes in the 50s and interceptions in the 20s, though they've attempted about 150 fewer passes at a much lower completion percentage. They and the Rams are the only two clubs to come in below the 10,000-yard mark since 2015.
Cleveland is the only team with a touchdown-to-interception ratio below 1:1.
While the league puts more emphasis on the pass than ever before, 23 of the 32 teams decreased their number of pass attempts last year.
Nobody has passed more over the last three years than the Baltimore Ravens, but only four teams have thrown more interceptions. The Ravens have zero playoff appearances in that span.
Only five teams have had three straight 4,000-yard passing seasons: the Lions, Saints, Patriots, Chargers and Steelers.
Become a Zone Coverage Member Today!

Think you could write a story like this? Hockey Wilderness wants you to develop your voice, find an audience, and we'll pay you to do it. Just fill out this form.
Recommended Comments
There are no comments to display.